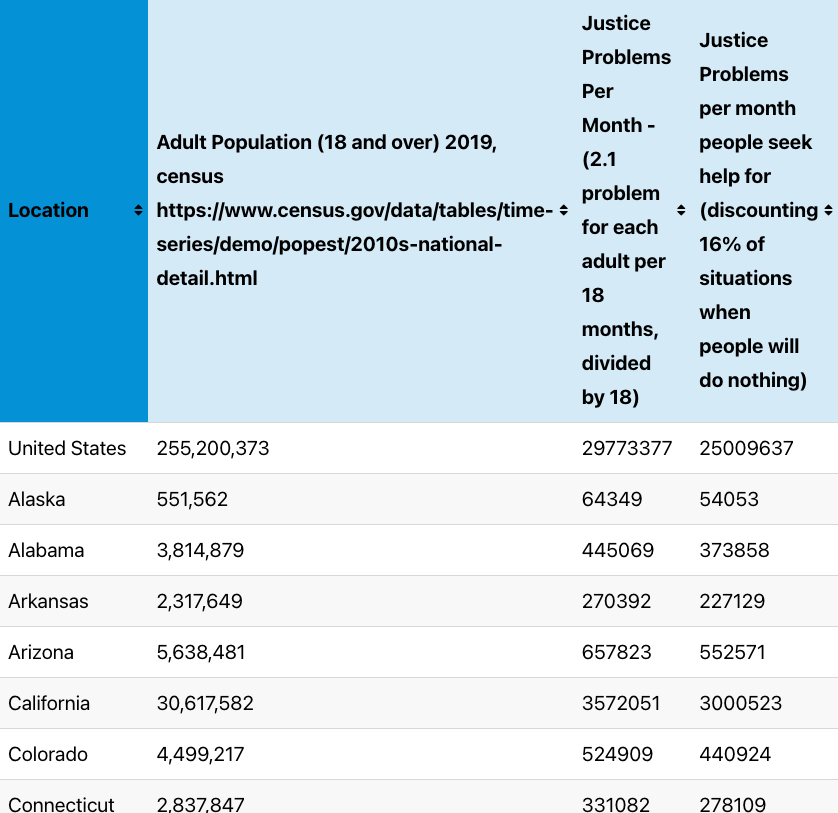
How many justice problems are there each month in different states? And how many people are seeking legal help each month?
This table presents some basic numbers of expected numbers of people who have justiciable civil legal issues, based on past social science research that detailed the frequency of people experiencing these issues — as well as the frequency of people seeking out help for these problems.
Your team can use this table as a ballpark approximate of how many people you might reach with your legal help services. It can be a denominator, which you can use to see how many of the eligible people you’re reaching with your website, app, or other services.
Justice Problem Estimates Per Month
This table shows rough estimates of how many justice problems each US state may expect its adult population to experience. It also shows how many problems are expected to be 'acted-upon' (in which the adult is taking action to seek information or services).It is based on Sandefur’s 2013 study "Accessing Justice in the Contemporary USA" that found, on average, US adults experienced 2.1 justice problems per 18 months. This frequency is then combined with the adult population count in each state to make ballpark estimates of the amount of Justice Problems that might be served with a legal help service.
How it calculates Justice Problem amounts: It takes the adult population (18 and over) in US states, according to the US census’ most recent projections for 2019 (Column B).
It multiplies that by 2.1, to get the 18-month total of justice problems. It divides that by 18, to get the monthly average of problems. (Column C)
How it calculates Acted-Upon Justice Problems: People do not always seek out help for the justice problem they are experiencing. In her study, Sandefur found that people did nothing in 16% of the time they experiencing a justiciable problem.
Based on that finding, the table calculates the number of totally monthly justice problems that we could expect people might be acting upon (Column D). This can give us an estimate of how many people are choosing to seek help for their problems, and who might be in the 'potential audience' for a legal help service.
| Location | Adult Population (18 and over) in 2019 | Estimated Justice Problems Per Month | Estimated Acted-Upon Justice Problems per month |
|---|---|---|---|
| United States | 255,200,373 | 29773377 | 25009637 |
| Alaska | 551,562 | 64349 | 54053 |
| Alabama | 3,814,879 | 445069 | 373858 |
| Arkansas | 2,317,649 | 270392 | 227129 |
| Arizona | 5,638,481 | 657823 | 552571 |
| California | 30,617,582 | 3572051 | 3000523 |
| Colorado | 4,499,217 | 524909 | 440924 |
| Connecticut | 2,837,847 | 331082 | 278109 |
| District of Columbia | 577,581 | 67384 | 56603 |
| Delaware | 770,192 | 89856 | 75479 |
| Florida | 17,247,808 | 2012244 | 1690285 |
| Georgia | 8,113,542 | 946580 | 795127 |
| Hawaii | 1,116,004 | 130200 | 109368 |
| Iowa | 2,428,229 | 283293 | 237966 |
| Idaho | 1,338,864 | 156201 | 131209 |
| Illinois | 9,853,946 | 1149627 | 965687 |
| Indiana | 5,164,245 | 602495 | 506096 |
| Kansas | 2,213,064 | 258191 | 216880 |
| Kentucky | 3,464,802 | 404227 | 339551 |
| Louisiana | 3,561,164 | 415469 | 348994 |
| Massachusetts | 5,539,703 | 646299 | 542891 |
| Maryland | 4,710,993 | 549616 | 461677 |
| Maine | 1,095,370 | 127793 | 107346 |
| Michigan | 7,842,924 | 915008 | 768607 |
| Minnesota | 4,336,475 | 505922 | 424974 |
| Missouri | 4,766,843 | 556132 | 467151 |
| Mississippi | 2,277,566 | 265716 | 223201 |
| Montana | 840,190 | 98022 | 82338 |
| North Carolina | 8,187,369 | 955193 | 802362 |
| North Dakota | 581,891 | 67887 | 57025 |
| Nebraska | 1,458,334 | 170139 | 142917 |
| New Hampshire | 1,104,458 | 128853 | 108237 |
| New Jersey | 6,943,612 | 810088 | 680474 |
| New Mexico | 1,620,991 | 189116 | 158857 |
| Nevada | 2,387,517 | 278544 | 233977 |
| New York | 15,425,262 | 1799614 | 1511676 |
| Ohio | 9,111,081 | 1062959 | 892886 |
| Oklahoma | 3,004,733 | 350552 | 294464 |
| Oregon | 3,351,175 | 390970 | 328415 |
| Pennsylvania | 10,167,376 | 1186194 | 996403 |
| Puerto Rico | 2,620,963 | 305779 | 256854 |
| Rhode Island | 854,866 | 99734 | 83777 |
| South Carolina | 4,037,531 | 471045 | 395678 |
| South Dakota | 667,558 | 77882 | 65421 |
| Tennessee | 5,319,123 | 620564 | 521274 |
| Texas | 21,596,071 | 2519542 | 2116415 |
| Utah | 2,274,774 | 265390 | 222928 |
| Virginia | 6,674,671 | 778712 | 654118 |
| Vermont | 509,984 | 59498 | 49978 |
| Washington | 5,951,832 | 694380 | 583279 |
| Wisconsin | 4,555,837 | 531514 | 446472 |
| West Virginia | 1,432,580 | 167134 | 140393 |
| Wyoming | 445,025 | 51920 | 43613 |

